Effect Size
The magnitude of difference between two groups
Overview
Types of Effect Size
Raw Score Effect Size
Raw score effect size provides the literal mean difference between mean group scores1.
| Symbol | Meaning |
|---|---|
| \(\mu_1\) | Sample 1 mean1 |
| \(\mu_2\) | Sample 2 mean1 |
\[ \textrm{Raw Score Effect Size} = \mu_1 - \mu_2 \]
Standardized Effect Size
The standardized effect size is the raw score effect size divided by the standard deviation of its respective population1.
| Symbol | Meaning |
|---|---|
| d | Cohen’s D (Effect Size)1 |
| \(\mu_1\) | Sample 1 mean1 |
| \(\mu_2\) | Sample 2 mean1 |
| \(\sigma\) | Standard Deviation of the Population |
\[ \textrm{d} = \frac{\mu_1 - \mu_2}{\sigma} \]
Standardized Effect size allows one to compare effect sizes between different measures. For example, standardized effect size allows a researcher to compare a pain scale from 0-43 to another pain scale which ranges from 0-101.
Note
- Notice that you are using standard deviation of the population (σ) not standard deviation of the distribution of means (\(\sigma_M\))1
- In addition you are only concerned with one population’s standard deviation1.
- In hypothesis testing, all of your participants should be from the same overall population1.
Example
Experiment A results:
- Control group mean: 200
- Experimental group mean: 220
- Raw Score Effect size: \(220-200=\textbf{20}\)
- Standardized Effect size: \(\textrm{d} = \frac{\mu_1 - \mu_2}{\sigma} =\frac{220-200}{48} = \textbf{0.416}\)
Experiment B Results
- Control group mean: 200
- Experimental group mean: 210
- Raw Score Effect size: \(210-200=\textbf{10}\)
- Standardized Effect size: \(\textrm{d} = \frac{\mu_1 - \mu_2}{\sigma} = \frac{210-200}{48} = \textbf{0.208}\)
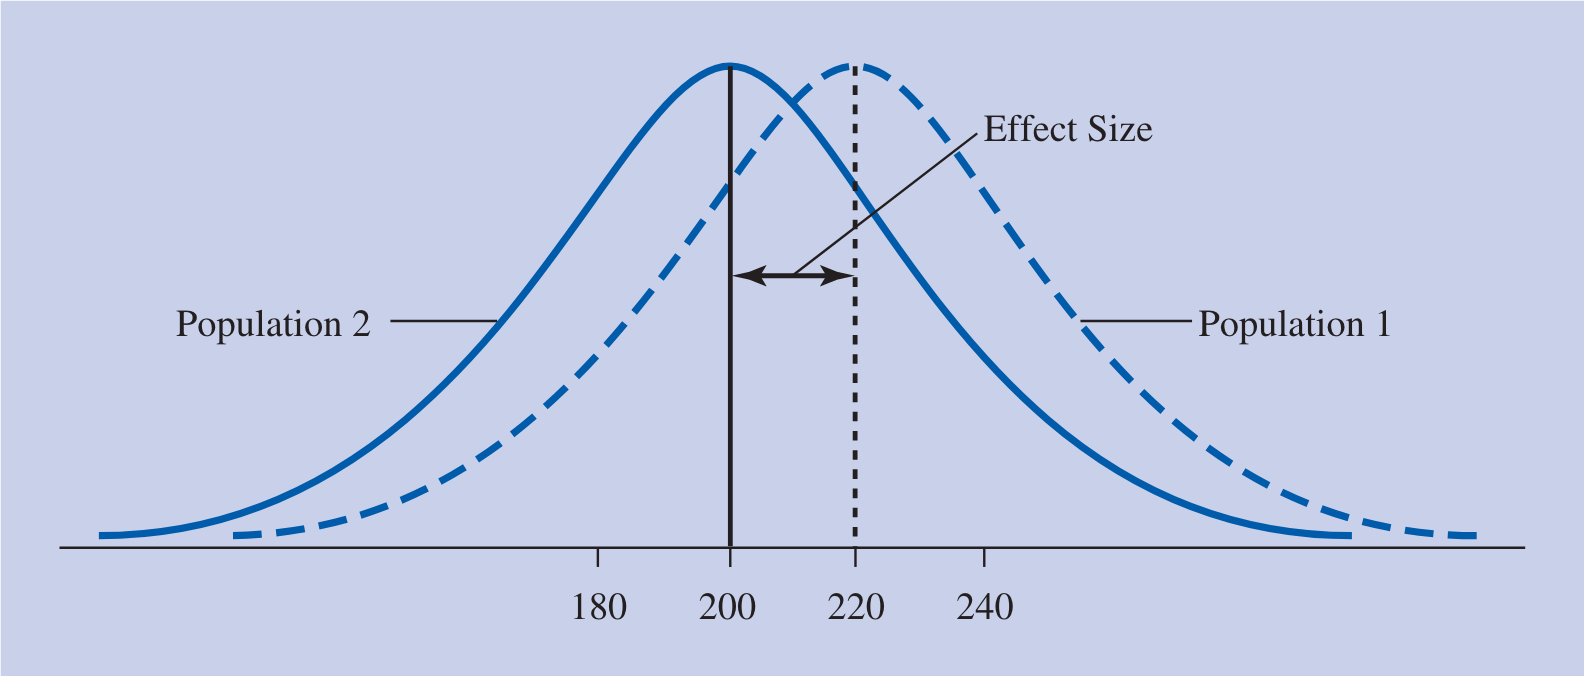
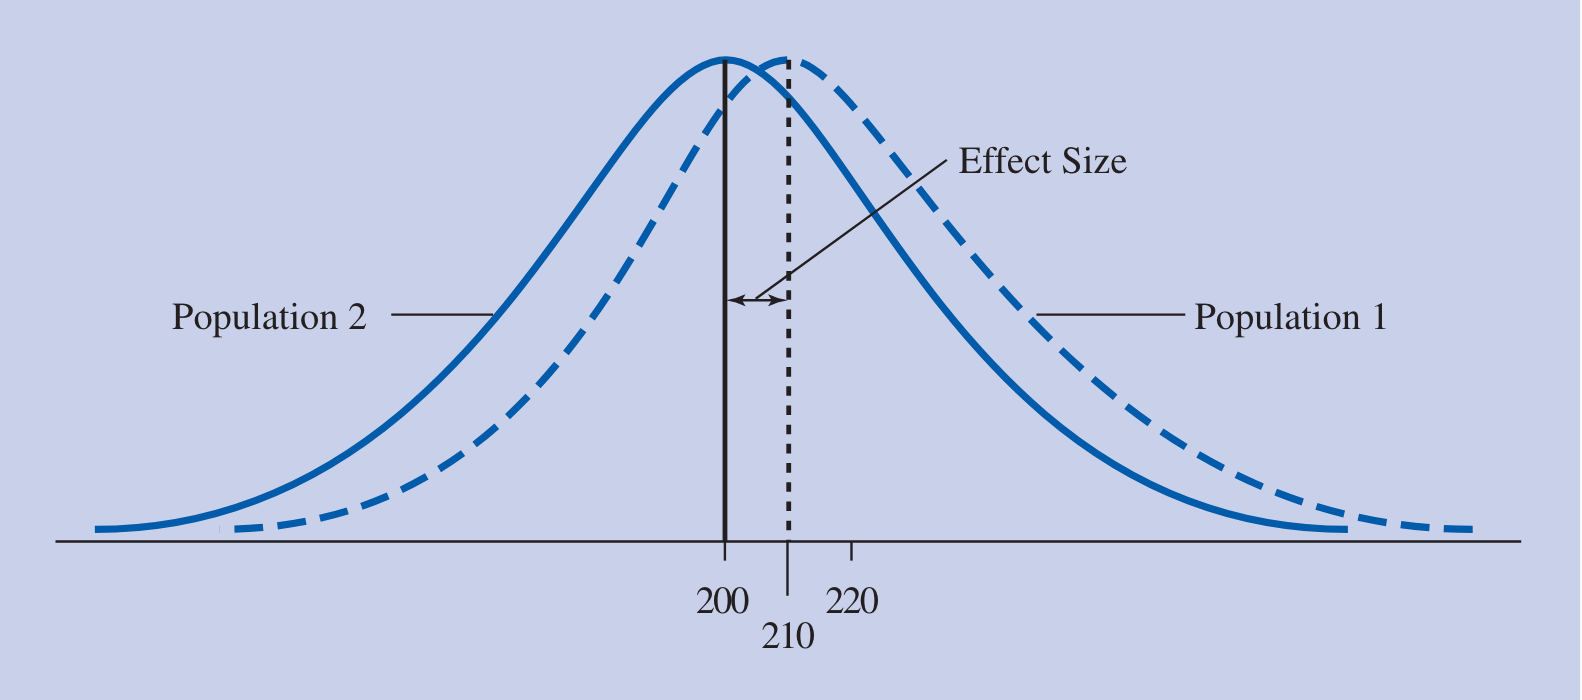
When comparing these two experiments, we can visually see that Experiment A has a much larger effect size.
References
1.
Aron A, Coups EJ, Aron E. Statistics for Psychology. 6th ed. Pearson; 2013.
Citation
For attribution, please cite this work as:
Yomogida N, Kerstein C. Effect Size. https://yomokerst.com/The
Archive/Evidene Based Practice/Statistical
Significance/effect_size.html